Skip to content
Complementary service

Dashboards & Data Visualization

Engineering intuitive, responsive data dashboards that turn complex datasets into clear, actionable visual intelligence for decision-makers.

Overview

Universitas builds interactive dashboards that connect directly to your databases. We create operational views, research observatories, and public data portals to track indicators in real time.

We unify data across sources into BI platforms such as Power BI, Tableau, and Looker Studio, or develop interactive web visualizations using Python and D3.js.

Who it is for

  • Academia: Research consortium observatories, grant dissemination hubs, and interactive scientific data explorers.
  • Businesses: Operations managers, finance leaders, and sales directors monitoring revenue, churn, and operational metrics.
  • Public Sector: Government transparency dashboards, municipal indicator portals, and public health surveillance systems.
  • NGOs & Non-Profits: Social impact indicator tracking, interactive dashboards for donor accountability, and community mobilization dashboards.

How we work

  1. KPI mapping: Aligning key questions with necessary metrics, refresh rates, and access controls.
  2. Data modeling: Extraction, cleaning, and semantic data schema modeling to guarantee performant queries.
  3. Interface design: Layouts with clear hierarchy, high data-to-ink ratio, and intuitive filter controls.
  4. Deployment and training: Secure deployment to organizational tenants accompanied by user training.
What we deliver

Interactive dashboard published to corporate tenant or public web application
Automated data pipeline connecting directly to operational databases or APIs
Technical reference manual and KPI dictionary
Hands-on team training and operational handover session

Frequently asked questions

Do you issue official invoices?

Yes. We issue official tax invoices (nota fiscal) for individuals, companies, and public institutions.

Which dashboard platforms do you support?

We support major enterprise BI tools (Power BI, Tableau, Looker Studio) as well as custom open-source web visualization stacks (Python, D3.js, Streamlit).

Can dashboards automatically update as new data arrives?

Yes. We set up automated ingestion schedules and direct queries connecting to SQL databases, REST APIs, or cloud spreadsheets.

How do you ensure visual clarity and user adoption?

We follow core information design principles, prioritizing clean visual hierarchy, low cognitive load, and iterative user testing.

Examples of Dashboards Created

•

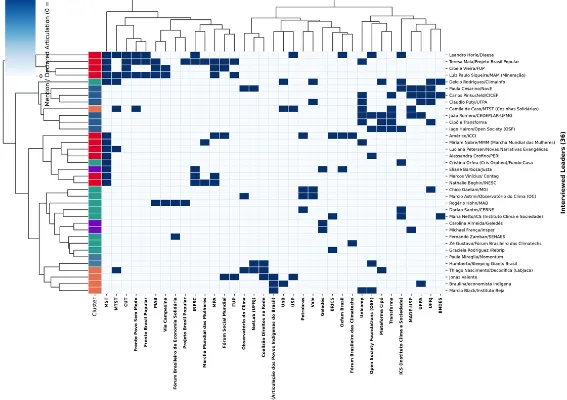
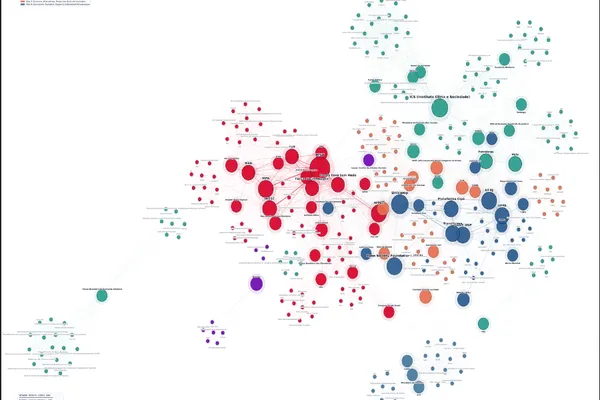
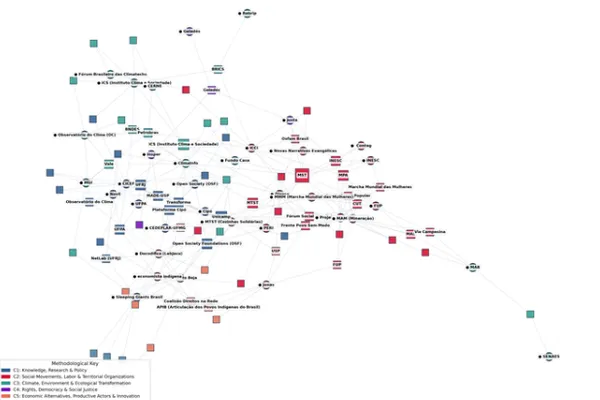
Python and D3.js: Network and Cluster Visualization

Global Map of the Network of Organizations
Network of Articulations and Poles
Bipartite Clustermap
•

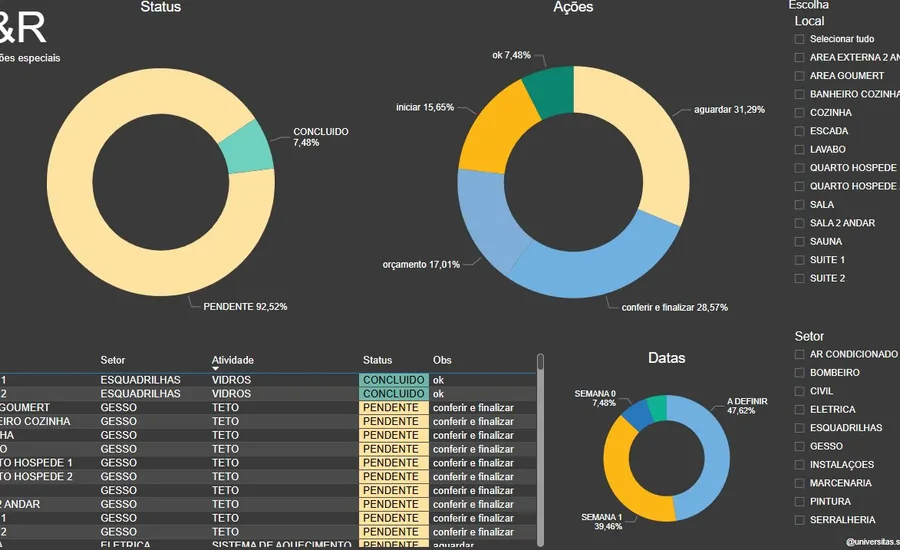
Power BI: LR Instalações Especiais

Executive Power BI dashboard showing operational and financial indicators
Português
Request a proposal